Last week I attended a conference organized by the university libraries in the Netherlands with the straightforward title: “What do we want from publishers?” The conference served as a consultation with librarians and other academics, before the universities in the Netherlands start negotiations about deals with commercial publishers such as Elsevier. I had missed the morning session, in which a panel of representatives from publishers and academia shared their views on the current state and future directions of academic publishing. In the sessions I attended I noticed signs of rebellion and resistance, with one speaker saying “we should be prepared to walk away” when commenting about the way libraries should approach negotiations with publishers.
Elsevier makes outrageously high profits, as do other academic publishers such as Springer/Nature, Taylor & Francis, and Wiley. As others have noted before (see here, here, and here), these profits often exceed those made by tech giants such as Apple and Google. The reason that profits of 30-40% per year are so outrageous is that publishers create these profits with unpaid work by academics. Scientists publishing in academic journals do not get paid for their contributions. In contrast: scientists often have to pay for publishing their articles. Publishers charge ‘Article Processing Charges’ (APCs) or open access fees to authors, to make the research available to the general public. Work that usually has been paid already by the general public (more about the business model of academic publishing here).
At the conference I learned that publishers seriously think that they add value to the work of academics by enticing us to spend our time as volunteer editors and peer reviewers. I’ll return to the merits of that argument below. First: why are academics – myself included – willing to voluntarily spend their time for commercial companies?
One reason is that academics see it as their duty and responsibility to review work by their peers, so that they can improve it. The peer review system is an economy of favors that relies on generalized reciprocity. As a responsible academic and decent human being, you should not free ride and expect your peers to review your work, while providing no service in return. If you receive three reviews for every article submitted, you should be prepared to review three other articles for the journal. Also there are individual benefits in review work. You learn about new research before it gets published, and you get a chance to influence it.
A collective trap
The systemic problem is that the academic community is trapped. Professional organizations of researchers such as the American Psychological Association benefit financially from the publishing industry. The associations are not prepared to give up the revenues from journals – they would not be able to finance their conferences, scholarships and other association activities without the journal revenues. In my former role as secretary of a professional association of researchers in the field of nonprofit and philanthropy research I completely understand this.
Universities and research funding agencies rely on the academic publishing industry to make decisions on grants for research, tenure and promotion to higher ranks, allocate time for research, and even bonuses to researchers. Universities and funding agencies do not directly evaluate the quality of the research that their employees produce. Instead they reward researchers who publish more proficiently, and especially in journals that are cited more frequently. Universities and funding agencies assume that a publication in a peer reviewed journal, especially in a journal that in the past published work that is cited more often, is a signal of quality. But here’s the catch: it’s not.
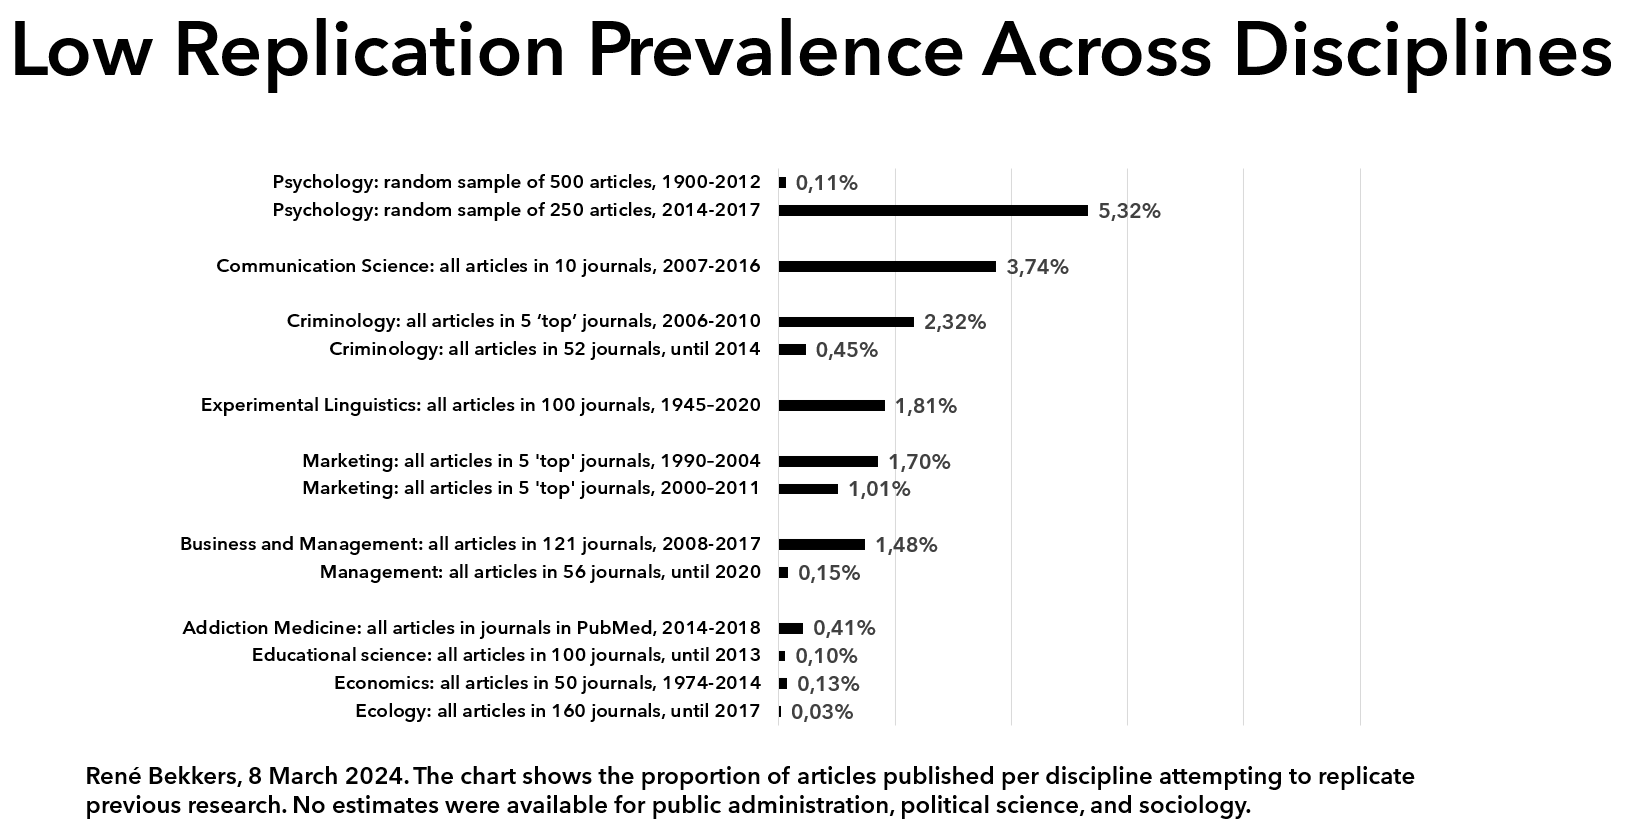
The average citation count of articles published in the past is not a good indicator of the quality of a newly published article. Citations follow a power law: a few articles are cited very often, while the majority of articles receive only a low number of citations. Because publishing in journals with a higher average number of citations is more attractive, these journals also attract more fraud and bad science. Journals are struggling to maintain the quality of published research, and the number of retractions is increasing strongly.
Counter to public belief, the fact that a study was peer reviewed does not indicate that it is of high quality. A skyrocketing number of ‘peer reviewed’ articles appear in predatory journals, that accept papers in exchange for payment, without any substantial or critical review. So-called ‘paper mills’ sell publications. Even citations are for sale. Also at respectable journals, peer reviewers are not good at detecting errors. The peer review system is under pressure. As the number of submissions and publications continues to increase, the willingness of researchers to review articles declines. It takes more time and more invitations to get researchers to say yes to requests to review.
Journals seem to do everything to make it difficult to evaluate the quality of the peer review. An overwhelming majority of journals does not publish the peer reviews of accepted articles. Still we know that peer review does not add quality in most cases. Published versions of articles that were posted earlier as a preprint are very similar (see here and here). If the version published in a journal is the same as the preprint, the journal have literally added nothing.
What we want from publishers
On my way to the conference I imagined four answers to the question what we want from publishers.
1) We want our money back, because publishers have extorted profits from academia.
2) Nothing at all, because publishers have not added value.
3) Radical transformation: commercial publishers exploiting public funding have no right to existence and should be transformed into non-profit organizations or social enterprises that put their profits back into science. Funding research on peer review, for instance.
Admittedly these three demands are quite revolutionary and rebellious. At the conference they worked as advocate of the devil statements forcing a clear statement by conversation partners on the value that publishers could add.
4) If commercial publishers are a necessary evil, and continue to exist, we want value for our money. Let publishers propose changes that improve the transparency and quality of the publications. Here are some ideas.
- Journals could provide a standardized list of ingredients for published articles, so that it is clear what went into them, with safety warnings for lax quality control, such as the lack of data and code review.
- Journals could structure peer review so that assessments become more fair, e.g. using rubrics similar to those we use to evaluate our students’ work.
- Journals could publish peer reviews to create transparency of the evaluation and improvement of manuscripts, a feasible system that improves the quality of peer reviews.
- Publications should include a link to the preprint and preregistration of the research.
- Manuscripts should not be published or even reviewed without accurate references to the underlying data.
- References to previous research, research materials, data sources and code should be structured and open.
- Claims based on data should be verified and demonstrably follow from the underlying data (simple example here, more elaborate example here).
- etcetera, and so on, usw.
These are just some of the things that journals could have done, but have neglected to enact in the past decades. It would be good if new deals contain agreements on these innovations.